
Eclipse and IntelliJ are the two competing IDEs in the industry. There are lot of passionate discussion going in the social media, forums to declare the winner in this race. We thought it would be a fun exercise to study which IDE utilizes memory efficiently?
Study
To conduct this study, we used Eclipse Java EE Oxygen Release Milestone 2(4.7.0 M2) and IntelliJ IDEA 2018.2.4 (Ultimate Edition). Both IDEs were running on Java 8.
To conduct this study effectively, we wanted to activate various features of the IDE. Thus, we ended up creating a simple Java project. In this project we created a JSP page, Manager class, DAO class which will write and read records from MySQL database. We were writing source code, compiling it, running unit tests to validate the behavior. It took us 1 hour and 45 minutes to do these activities. We conducted exact same exercise in both Eclipse and IntelliJ IDE.
How to study memory efficiency?
One of the best ways to study memory behavior of an application is to analyze garbage collection activity. Garbage collection activity would clearly show memory utilization pattern, object creation rate, object reclamation rate, Garbage collection pause time and other memory related details in nirvana.
How to study Garbage Collection activity?
Garbage collection activity can be studied by enabling Garbage Collection logs and using right tools to analyze Garbage collection logs. Garbage collection logs can be enabled by passing following JVM arguments:
-XX:+PrintGCDetails

-XX:+PrintGCDateStamps

-Xloggc:{GC-log-file-path}
For this exercise we used GCeasy tool to analyze garbage collection logs.
In the folder where Eclipse is installed there is eclipse.ini file. Its contents were looking like this:
-startup

plugins/org.eclipse.equinox.launcher_1.3.200.v20160914-0716.jar

--launcher.library

plugins/org.eclipse.equinox.launcher.win32.win32.x86_64_1.1.400.v20160914-0716

-product

org.eclipse.epp.package.jee.product

--launcher.defaultAction

openFile

-showsplash

org.eclipse.platform

--launcher.defaultAction

openFile

--launcher.appendVmargs

-vmargs

-Dosgi.requiredJavaVersion=1.8

-XX:+UseG1GC

-XX:+UseStringDeduplication

-Dosgi.requiredJavaVersion=1.8

-Xms256m

-Xmx1024m
At the bottom of this file we added following arguments to enable garbage collection logs of the Eclipse IDE.
-XX:+PrintGCDetails

-XX:+PrintGCDateStamps

-Xloggc:D:\my_workspace\logs\eclipse-gc.log
In folder where IntelliJ is installed you will notice idea64.exe.vmoptions file. Its contents were looking like this:
-Xms256m

-Xmx1024m

-XX:ReservedCodeCacheSize=240m

-XX:+UseConcMarkSweepGC

-XX:SoftRefLRUPolicyMSPerMB=50

-ea

-Dsun.io.useCanonCaches=false

-Djava.net.preferIPv4Stack=true

-Djdk.http.auth.tunneling.disabledSchemes=""

-XX:+HeapDumpOnOutOfMemoryError

-XX:-OmitStackTraceInFastThrow
At the bottom of this file we added following arguments to enable garbage collection logs of the IntelliJ IDE.
-XX:+PrintGCDetails

-XX:+PrintGCDateStamps

-Xloggc:D:\my_workspace\logs\intellij-gc.log
NOTE: By default, IntelliJ’s initial heap size is kept as 128mb and max heap size is set to 750mb. Whereas Eclipse initial heap size was set to 256mb and max heap size set to 1024mb. Thus, to make apples to apples comparison we bumped up IntelliJ’s initial heap size to 256mb and max heap size to 1024mb.
Memory Behavior Comparison
Once our 1 hour and 45 minutes exercise was complete, we uploaded the garbage collection log file generated by both IDEs to GCeasy tool. Below are the detailed analysis reports generated by the tool. We encourage you to look at the report:
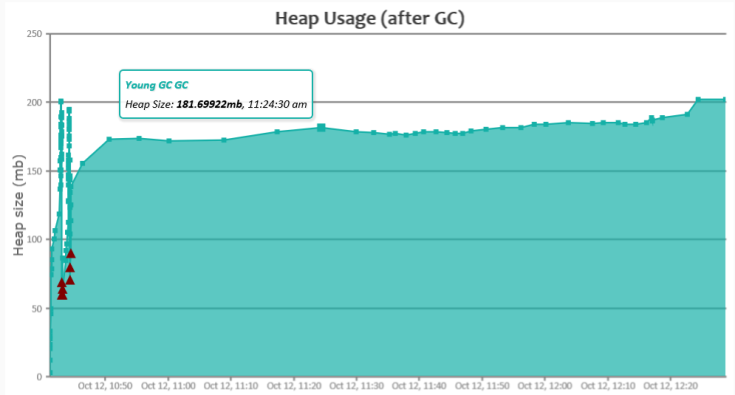
Below are the key observations from the GC analysis report:
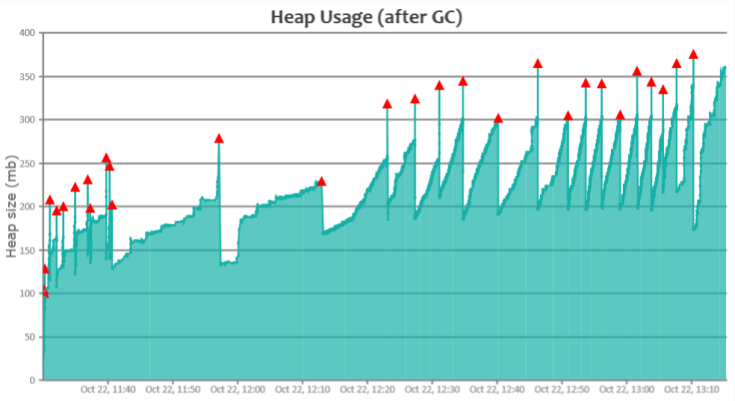
#1. Object Creation Rate
Apparently Eclipse created very small number of objects when compared to IntelliJ. Eclipse IDE was creating objects at the rate of 2.41 MB/sec, whereas IntelliJ was creating objects are the rate of 69.65 MB/sec (which is like 29x more than Eclipse). For the entire run Eclipse created only 15.19 GB, where IntelliJ created 430.2 GB of objects. Since more objects were created, CPU consumption was also higher when using the IntelliJ IDE.
#2. GC Pause Time
During certain phases of garbage collection entire application is paused. Apparently, Eclipse’s average GC pause time is 33 ms and max GC pause time is 340 ms. On the other hand, IntelliJ’s average GC pause time is only 8 ms and max GC pause time is 270 ms. Thus, in terms of GC Pause IntelliJ is comparatively better. Even though IntelliJ’s object creation rate is higher, however its average pause time is comparatively better than Eclipse because of better GC tuning done in IntelliJ.
#3. GC Throughput
GC Throughput is basically the amount of time your application spends in processing customer’s transactions vs amount of time your application spends in Garbage collection. In our study, Eclipse throughput is 99.924%, whereas IntelliJ’s through is 99.146%. Eclipse GC throughput is better than IntelliJ’s throughput.
#4. GC Algorithm
One of the primary reasons for GC pause time is influenced by the Garbage Collection algorithm and settings. Eclispe was configured to run with G1 GC algorithm, whereas IntelliJ was configured to run with CMS GC algorithm. Given that Eclipse is creating much less objects, with proper GC tuning, we believe Eclipse GC pause time can be reduced further.
#5. System.gc() calls
Apparently Eclispe IDE is issuing System.gc() calls explicitly. Unless there is a necessity, it’s not recommended to issue System.gc() from the application, as it muddles with JVM GC activity. It’s unclear why Eclipse IDE is explicitly issuing System.gc() calls.
Conclusion
Based on this limited study that we conducted, we can say that Eclipse IDE is memory efficient than IntelliJ, because to do same amount of work, IntelliJ is creating 29x more objects than Eclipse. On the other hand, IntelliJ’s pauses times are comparatively better than Eclipse. Of course, we believe that IDE selection shouldn’t be based on memory efficiency. It should be based on feature set, user preference and productivity criteria.
*Important*: Join the AndroidVille SLACK workspace for mobile developers where people share their learnings about everything latest in Tech, especially in Android Development, RxJava, Kotlin, Flutter, and mobile development in general.
Click on this link to join the workspace. It’s absolutely free!
Like what you read? Don’t forget to share this post on Facebook, Whatsapp, and LinkedIn.
You can follow me on LinkedIn, Quora, Twitter, and Instagram where I answer questions related to Mobile Development, especially Android and Flutter.
If you want to stay updated with all the latest articles, subscribe to the weekly newsletter by entering your email address in the form on the top right section of this page.